
When something breaks on your WordPress site, your first job is to find out why. Debugging is really just the process of finding that root cause, and it usually starts with activating WordPress's built-in error reporting tools.
By making a simple edit to your wp-config.php file, you can activate WordPress's debug mode. This reveals the underlying PHP errors that are normally kept hidden, turning a frustrating white screen or a broken feature into an actual, actionable error message.
Why Debugging in WordPress Feels So Complex
If you’ve ever found yourself staring down a broken WordPress site, you know the feeling. The problem isn’t that WordPress is badly made—far from it. The issue is that your website is a living, breathing ecosystem. The core software is just one piece of the puzzle, constantly interacting with your theme and a unique mix of plugins. This is where things get complicated.
A simple plugin update can cause a fatal error. A minor theme tweak can create a conflict with another plugin's JavaScript. When you debug in WordPress, you’re not just troubleshooting a single piece of software; you're investigating the complex relationships between dozens of them. The real problem might not even be in the component that seems to be broken.
Understanding Common Conflict Points
To get to the bottom of an issue, it helps to know where problems tend to hide. Instead of just randomly deactivating plugins and hoping for the best, you can be more strategic by focusing on these common culprits first:
- Plugin and Theme Conflicts: This is, by far, the most frequent source of errors. Two plugins might try to use the same function name, or a theme’s code could be incompatible with a recent WordPress core update.
- PHP Version Mismatches: Sometimes a plugin needs a newer version of PHP than what your server is running. This can cause it to fail silently or throw a critical error that brings down your whole site.
- Database Connection Failures: A simple typo in your
wp-config.phpfile or a problem with your hosting server can stop WordPress from talking to its database.
This complexity is made even bigger by the sheer size of the WordPress world. WordPress powers approximately 43.5% of all websites globally, which means the number of potential software combinations is astronomical. It also means that poorly coded or outdated add-ons, which are responsible for about 95% of reported vulnerabilities, are a major source of bugs that need fixing.
The key takeaway is this: Debugging isn't about blaming WordPress. It's about methodically isolating the component—be it a plugin, theme, or custom code snippet—that has broken the delicate harmony of your site.
Effective troubleshooting requires a consistent process. For anyone managing multiple sites, having a solid https://wpfoundry.app/wordpress-website-maintenance/ plan is the best way to prevent these issues from happening in the first place. Once you understand these dynamics, you can move from panicked guessing to confident, effective problem-solving.
Activating WP_DEBUG The Right Way
The first real step in hunting down a WordPress bug is to turn on its built-in diagnostic mode. This involves a small edit to your wp-config.php file, the absolute heart of your WordPress installation. Think of this file as your site's central command—it holds database credentials and the core settings that make everything run.
Because wp-config.php is so vital, you need to handle it with care. One misplaced comma can bring your entire site down. Before you touch anything, always make a backup. Just connect to your site with an FTP client or your host's file manager, find the file in your root directory, and download a copy to your computer. Better safe than sorry.
The Three Core Debug Constants
Getting debug mode running properly isn't just a single on/off switch. To do it safely and effectively, you need to add a combination of three specific constants to your config file.
With WordPress powering nearly 43.6% of all websites using a content management system in 2025, having a solid debugging process is non-negotiable. You can dig into more details by checking out the latest WordPress statistics from Invedus.
You'll want to add the following snippet to your wp-config.php file. The best spot is usually right above the line that says /* That's all, stop editing! Happy publishing. */.
// Enable WP_DEBUG mode
define( 'WP_DEBUG', true );
// Enable Debug logging to the /wp-content/debug.log file
define( 'WP_DEBUG_LOG', true );
// Disable display of errors and warnings on the front end
define( 'WP_DEBUG_DISPLAY', false );
This setup does three critical things:
WP_DEBUG: This flips the main switch, turning on error reporting.WP_DEBUG_LOG: This tells WordPress to save every error it finds into a private file calleddebug.log, which will appear in your/wp-content/folder.WP_DEBUG_DISPLAY: This keeps errors hidden from your site's front end, which is essential for both security and a good user experience.
Here's a simple visual of how this workflow helps you pinpoint an error.
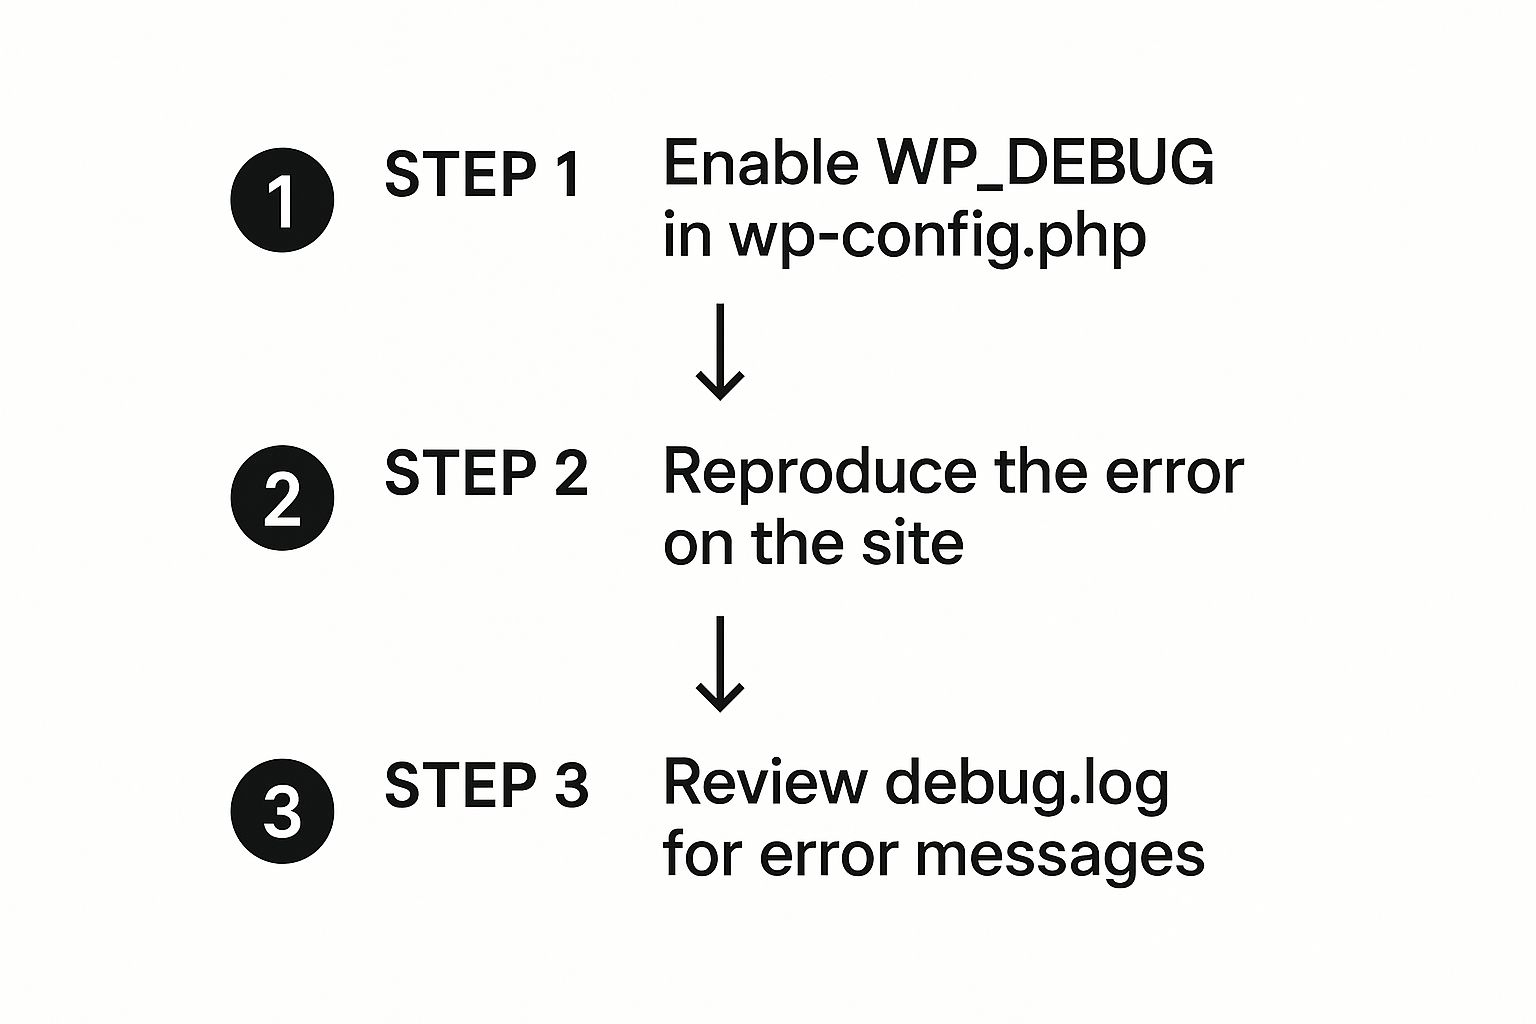
The process is simple: enable the settings, do whatever it is that's causing the problem on your site, and then open up the log file to see exactly what WordPress caught.
WP_DEBUG Configuration Constants Explained
To really get a handle on these settings, here’s a quick breakdown of what each constant does and how you should use it depending on whether you're working on a live site or a development copy.
| Constant | Purpose | Development Setting | Live Site Setting |
|---|---|---|---|
| WP_DEBUG | The master switch for turning on PHP error, notice, and warning reporting. | true |
false |
| WP_DEBUG_LOG | When WP_DEBUG is on, this saves all errors to a debug.log file in /wp-content/. |
true |
false (or true with caution) |
| WP_DEBUG_DISPLAY | Controls whether error messages are shown directly on your site's HTML pages. | false |
false |
Having WP_DEBUG_LOG on without displaying errors is the key to catching problems without your visitors ever knowing something is wrong.
Production vs. Development Environments
The three-line snippet above is perfect for a development or staging site, where you need to see all the messy details under the hood. On a live production site, however, your approach must be different. You should never leave WP_DEBUG or WP_DEBUG_DISPLAY set to true on a website that the public can see.
Showing raw PHP errors to visitors is a massive security risk. These messages can leak server file paths, database info, and other sensitive details that a hacker could easily use against you.
For any live site, the main debug constant should always be turned off:
define( 'WP_DEBUG', false );
This ensures that if something breaks, your visitors see a generic error page, not the technical guts of the problem. If you absolutely have to monitor for issues on a live site, you can keep WP_DEBUG_LOG enabled while making triple-sure that WP_DEBUG_DISPLAY is off. But the gold standard is to do all your debugging on a staging copy. It's the only way to work without risking your site's security or your users' experience.
How to Read Your WordPress Debug Log
Turning on the debug log is one thing, but knowing how to read it is where the real magic happens. The first time you open up your debug.log file (you'll find it in the /wp-content/ folder), it can look like a mess of technical code. Don't worry, it's easier to decipher than it looks.
Think of each entry as a timestamped incident report from your website. It’s your job to read these little reports and connect the dots. Once you get the hang of it, this log will become your go-to tool to debug in WordPress.
The Anatomy of a PHP Error
Every single line in your debug log is pointing you toward a specific problem. The trick is knowing how to pull apart the information. A standard error line has a few key pieces you need to spot.
Here’s what you should look for in every entry:
- Error Type: It will clearly label the issue as a
Notice,Warning, orFatal error. This immediately tells you how serious the problem is. - Error Description: This part gives you a quick, plain-English summary of what's wrong. You'll see things like "Undefined variable: user_name" or "Call to undefined function
my_custom_function()." - File Path: This is the full server path to the exact file causing the trouble, something like
/home/user/public_html/wp-content/plugins/some-plugin/main.php. - Line Number: Right after the file path, it gives you the specific line of code that triggered the error, such as
on line 257.
This structure gives you a direct map to the source of the problem. No more guessing which plugin or theme is misbehaving; the log will often point you right to it.
Once you learn to spot these four pieces of information, you stop guessing and start knowing exactly where to look. This is the single most important step you can take toward troubleshooting WordPress efficiently.
Prioritizing Error Types
Not all errors are created equal. Your log will show you everything from minor coding hiccups to full-on site crashes. Knowing the difference is key to figuring out what to fix first.
The three main types of PHP errors you'll run into have different levels of urgency.
-
PHP Notice: This is the most common and least severe type of error. Think of it as a helpful suggestion from PHP about code that could be a problem but isn't actually breaking anything. A classic example is trying to use a variable before it’s been defined. These are good to clean up for code hygiene, but they rarely cause visible problems for your visitors.
-
PHP Warning: Now we're getting more serious. A warning points to an issue that won't stop the script from running entirely, but it could cause unexpected behavior. A common warning is when code tries to include a file that doesn't exist. The page might still load, but some features could be broken or missing.
-
PHP Fatal Error: This is the big one. A fatal error brings the script to a dead stop. These are the culprits behind the infamous "White Screen of Death." If you see a fatal error in your log, it’s your top priority because it has already crashed some part of your site.
By sorting errors this way, you can focus your attention on the fatal errors and warnings that are actively hurting your site. You can always come back to the notices later.
Using Browser and Plugin Debugging Tools
Not every problem you run into is happening on the server. Plenty of tricky issues, especially the ones that mess with how your site looks or behaves, are actually happening right in your visitor's browser. Knowing how to shift your focus from server-side PHP to client-side code is a crucial skill to debug in WordPress, and it opens up a whole new category of bugs you can fix.
This is where your browser's built-in developer tools come in. Every modern browser—Chrome, Firefox, Edge—is packed with a powerful suite of tools that let you poke around your site's code, hunt down JavaScript errors, and even test out CSS changes on the fly.
Taming Client-Side Errors with Browser DevTools
The two tabs you'll live in most are the Inspector and the Console. You can usually get to them by hitting F12 or right-clicking anywhere on your site and choosing "Inspect." The Inspector is perfect for figuring out visual glitches—it shows you the HTML and CSS that build your page, so you can see exactly why a button is the wrong color or an element is out of place.
The Console, on the other hand, is your direct line to the JavaScript running on the page. If a photo slider stops sliding or a contact form refuses to submit, a JavaScript error is the likely culprit. The Console will flag these errors in red, often pointing you to the exact script and line number that’s causing the trouble. Just remember, these kinds of client-side problems can often be tangled up with caching. A good first step is always learning how to clear your WP cache before you start digging deeper.
Supercharging Your Debugging with Specialized Plugins
While WP_DEBUG and your browser's tools are fantastic, sometimes you need more specific intelligence about what’s going on inside WordPress itself. This is where a couple of dedicated debugging plugins can give you insights you just can't get anywhere else.
Two of the most essential plugins for this are:
- Debug Bar: This handy plugin adds a simple menu to your admin bar showing query info, cache details, and other useful server-side data. It's a quick and easy way to get a health check on any page.
- Query Monitor: This is the undisputed king of WordPress debugging plugins. It goes way beyond Debug Bar, showing you every single database query, hook, HTTP API call, and script firing on the page.
With Query Monitor, you can finally find the smoking gun. It helps you answer questions like, "Which plugin is making 200 database calls on my homepage and slowing everything down?" It turns vague performance problems into concrete, actionable data.
The WordPress ecosystem is massive. With more than 70,000 plugins out there, the potential for conflicts and performance headaches is huge. This is precisely why tools like Query Monitor are so vital for daily maintenance. WordPress sites serve nearly 20 billion monthly page views, creating immense performance demands. You can find more stats about the WordPress ecosystem on WPZOOM.
A Real-World Example with Query Monitor
Let's say your site’s admin area has slowed to a crawl. You've checked the server error logs and found nothing. This is a perfect job for Query Monitor.
Install and activate it, then head over to the slow-loading page in your admin dashboard. Open the Query Monitor panel at the top. You might find a section called "Queries by Component" that shows one of your security plugins is running dozens of slow SELECT queries every single time an admin page loads.
Suddenly, you're not guessing anymore. You know exactly which plugin is the bottleneck. From here, you can search for a lighter alternative, dig into its settings for a less intensive option, or reach out to the developer with the specific, slow queries you discovered. That's how you go from being stuck to solving the problem.
Advanced WordPress Debugging Techniques
When the standard debug log isn’t cutting it, you need to bring in the heavy hitters. Advanced techniques go beyond just reading error messages; they let you get hands-on with your code while it's actually running. This is absolutely critical for hunting down those tricky, intermittent bugs that don’t leave an obvious trail.
For any serious developer, this usually means firing up a tool like Xdebug. When you pair it with a code editor like VS Code, Xdebug lets you set breakpoints directly in your PHP code. Think of a breakpoint as a deliberate pause button. The code execution stops dead on a specific line, letting you poke around and inspect the state of every single variable at that exact moment.
Step-Through Debugging with Xdebug
Let's say you've got a function that’s miscalculating a price, but only for certain products. Instead of adding a dozen var_dump() calls and hoping for the best, you can place a single breakpoint at the beginning of that function.
Once the code hits your breakpoint, you can take complete control:
- Step Over: Run the current line and immediately move to the next one.
- Step Into: If the line is a function call, this command lets you dive inside that function to see what it’s doing.
- Step Out: Once you've seen enough, this finishes the current function and pops you back out to where it was called from.
This methodical, line-by-line inspection is the most powerful way to see what your code is really doing. It completely removes the guesswork.
Using WP-CLI for Emergency Access
What happens when a bad plugin or theme error locks you out of your WordPress admin dashboard entirely? This is where the WordPress Command Line Interface (WP-CLI) becomes your best friend. It’s a tool that lets you manage your entire site from a server terminal, completely bypassing the web interface.
WP-CLI is your emergency toolkit. When a faulty plugin gives you the White Screen of Death, you can't log in to deactivate it. But with WP-CLI, a simple command like
wp plugin deactivate faulty-plugin-namecan instantly disable it and bring your site back online.
You can also use WP-CLI to switch themes, add or remove users, and even run raw database queries. If you’re serious about how to debug in WordPress, learning a few essential WP-CLI commands is a non-negotiable skill for getting out of a jam.
The Non-Negotiable Staging Environment
Finally, the most important "advanced" technique isn't a tool at all—it's a process. All serious debugging and development must happen on a staging site. A staging site is simply an exact clone of your live website, tucked away on a private server or subdomain.
Trying to fix things directly on a live site is a recipe for disaster. A staging environment gives you a safe, isolated sandbox to break things without a single visitor knowing. You can enable WP_DEBUG, install diagnostic tools, and test fixes aggressively without any risk.
Once you’ve confirmed everything works perfectly, you can confidently push the changes to your live site. This one habit will prevent more headaches than any debugging tool could ever fix.
Common WordPress Debugging Questions
As you get more familiar with troubleshooting WordPress, you'll start to notice the same questions pop up time and again. Let's walk through some of the most common ones that developers and site owners run into.
What Is the White Screen of Death
The infamous "White Screen of Death" (WSOD) is exactly what it sounds like: you go to your website and all you see is a blank, white screen. It's a sign that WordPress has run into a critical PHP or database error that's so severe, it couldn't even start rendering the page.
More often than not, this is caused by a conflict—a plugin clashing with your theme, or two plugins not playing nicely together. The first and most important step is always to enable WP_DEBUG. Instead of that useless blank screen, WordPress will show you an actual error message, pointing you right to the file and line number that caused the crash.
The WSOD is intimidating, but it's really just a suppressed fatal error. Your job as a troubleshooter is to uncover that hidden message, and
WP_DEBUGis the tool that lets you do it.
Should I Leave WP_DEBUG on a Live Site
No, you absolutely should not. Keeping define('WP_DEBUG', true); active on a public, live website is a serious security risk, especially if WP_DEBUG_DISPLAY is also on.
When you display raw PHP errors to the public, you can expose all sorts of sensitive information, including full server file paths and snippets of your code. An attacker can use these details to figure out your site's structure and hunt for potential vulnerabilities.
For any production site, your wp-config.php file should always have this line:
define('WP_DEBUG', false);
If you really need to monitor for issues on a live site, the safer way is to use the logging feature. Set WP_DEBUG_LOG to true but make sure WP_DEBUG_DISPLAY is firmly set to false.
Why Is My Debug Log File Not Being Created
So you've enabled logging, but the debug.log file is nowhere to be found in your /wp-content/ directory. This usually comes down to one of two things.
First, go back to your wp-config.php file and double-check that both of these lines are there and spelled correctly:
define( 'WP_DEBUG', true );define( 'WP_DEBUG_LOG', true );
The second, and more common, reason is a file permissions issue. WordPress needs the right permissions to create a new file inside the /wp-content/ directory. If the permissions are too restrictive (they should typically be 755 for directories), the server will simply block WordPress from writing the log file.
Running a quick check with a tool that can perform a WordPress scan for vulnerabilities can often highlight permissions problems and other security misconfigurations that might be causing this.
Ready to take control of your WordPress sites? WP Foundry centralizes plugin, theme, and user management into one powerful desktop app. Stop juggling dozens of tabs and start managing your sites efficiently. Get your license today at https://wpfoundry.app.